BIMTECH Business Perspectives

 Search

Amol Adkonkar1, Anand Sharma1 and Pooja Arora2
1 Department of Pharmaceutical Management, National Institute of Pharmaceutical Education and Research, S.A.S. Nagar, Mohali, Punjab, India
2 Department of Pharmacoinformatic, National Institute of Pharmaceutical Education and Research S.A.S. Nagar, Mohali, Punjab, India

Creative Commons Non Commercial CC BY-NC: This article is distributed under the terms of the Creative Commons Attribution-NonCommercial 4.0 License (http://www.creativecommons.org/licenses/by-nc/4.0/) which permits non-Commercial use, reproduction and distribution of the work without further permission provided the original work is attributed.
Effective pharmaceutical supply chain management (SCM) plays a pivotal role as the foundation of organizational success. This study aims to investigate the variations in supply chain management practices (SCMP), competitive advantage (CA), organizational performance (OP), and supply chain management agility (SCMA) between listed and unlisted companies in India’s pharmaceutical sector. The data were gathered using a structured questionnaire, developed through a comprehensive literature review and pilot-tested in Goa. A purposive sampling approach was adopted, with responses from 192 senior supply chain professionals analyzed using advanced statistical techniques and neural network models. A holistic analysis using the Mann–Whitney test revealed no significant differences in SCMP, CA, SCMA, and OP between listed and unlisted pharmaceutical companies. The data were further segmented into large-cap, mid-cap, small-cap, and unlisted companies. Subsequent analysis with the Kruskal–Wallis test identified significant differences in strategic supplier partnerships (SSP), price, delivery dependability (DD), product innovation (PI) and time to market (TTM) across the categories. Large-cap companies ranked highest in SSP, price, DD, PI, and TTM, followed by mid-cap, unlisted, and small-cap companies. Additionally, large-cap companies exhibited the least variability, with mid-cap, small-cap, and unlisted companies showing progressively greater variability.
Supply chain management practices, competitive advantage, organizational performance, supply chain management agility
Introduction
The competitive landscape has intensified due to rivalry among established firms and emerging players. In response, organizations have increasingly prioritized internal factors, such as cost optimization and supply chain efficiency, to boost profitability (Choon Tan et al., 2002). Wisner et al. (2021) highlighted that the core objective of supply chain management (SCM) is to deliver value to end users while enhancing value at every stage of the process to ensure the final product aligns with customer needs. Efficient allocation of resources throughout the value chain helps minimize unnecessary costs and eliminate various forms of waste, thereby improving overall profitability (Kumar et al., 2012).
SCM plays a crucial role in the pharmaceutical industry, acting as a critical link in the production and delivery of medicines to patients (Faggioni et al., 2023). To ensure the continuous availability of essential medications, pharmaceutical companies must develop resilient and shock-resistant supply chains capable of withstanding uncertainties (Pattanshetty et al., 2023). Although optimizing supply chain efficiency presents a significant challenge, organizations with well-structured and streamlined supply chains gain a notable competitive advantage over their peers (Moosivand et al., 2019).
This study aims to examine the differences in supply chain management practices (SCMP), supply chain management agility (SCMA), competitive advantage (CA), and organizational performance (OP) between listed and unlisted pharmaceutical companies in India. SCMPs are delineated through five subconstructs, namely, strategic supplier partnership (SSP), customer relationship (CR), information sharing quality (IQ), information sharing level (IS), and postponement (POS). CA is given by five subconstructs, namely, price, product quality (QL), delivery dependability (DD), product innovation (PI), and time to market (TTM). OP consists of two constructs: financial performance (OP_FP) and market performance (OP_MP). SCMA is represented by two subconstructs, viz., organizational agility (SCMA_OA) and supply chain agility (SCMA_SCA).
In India, listed companies are those whose shares are publicly traded on stock exchanges such as the Bombay Stock Exchange (BSE) and the National Stock Exchange, adhering to regulations established by the Securities and Exchange Board of India (Al-Homaidi et al., 2021). On the other hand, unlisted companies are privately held entities whose shares are not traded on any stock exchange (Gupta et al., 2022). As per BSE’s classification, listed companies are categorized into small-, mid-, and large-cap firms. Market capitalization, which reflects a company’s total market value, is calculated by multiplying the price of its shares by the total number of shares outstanding (Kuvshinov & Zimmermann, 2022). According to the BSE classification, companies ranked 1st to 100th based on market capitalization are categorized as large-cap, those ranked 101st to 250th are classified as mid-cap, and companies ranked 251st and beyond fall under the small-cap category (Raju, 2024).
This study examines and compares the differences in SCMP, CA, OP, and SCMA between listed and unlisted pharmaceutical companies. Listed companies, driven by stricter regulatory requirements and greater transparency obligations, often adopt distinct operational strategies, whereas unlisted companies typically enjoy more operational flexibility (Hess, 2019). Figure 1 illustrates the study’s framework, adapted from the work of Lee et al. (2006). This comparative analysis offers valuable insights into how a company’s listing status impacts its supply chain effectiveness and competitive positioning within the pharmaceutical industry.
Figure 1. Construct Framework
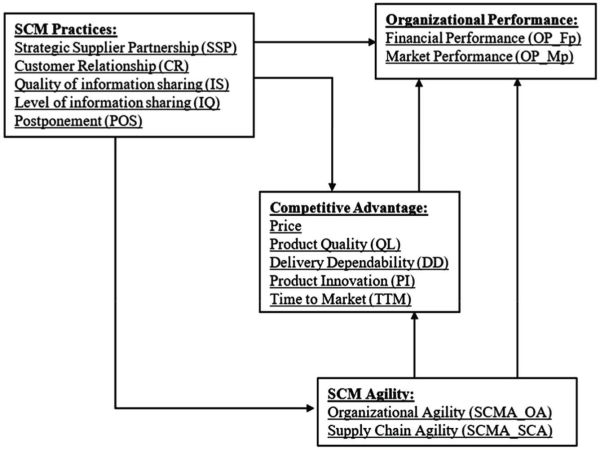
Source: https://doi.org/10.1016/j.omega.2004.08.002
The study is divided into two phases. In the first phase, companies are classified as either listed or unlisted, irrespective of their size (market capitalization) and analyzed using the Mann–Whitney U test. In the second phase, companies are grouped into four categories—small-cap, mid-cap, large-cap, and unlisted—and further analyzed using the Kruskal–Wallis test. The present study investigates the differences in SCMP, CA, OP, and SCMA between listed and unlisted pharmaceutical companies to provide critical insights into industry dynamics. By classifying companies based on market capitalization, the analysis seeks to highlight how organizational size affects supply chain strategies and performance. The findings aim to enrich the existing literature by offering a holistic view of supply chain operations across diverse pharmaceutical companies.
Literature Review
SCM Practices
SCMP comprises a comprehensive framework that covers strategies and tactics to be adopted by organizations to improve the efficiency, effectiveness and overall performance of the supply chains (Li et al., 2006). The implementation of SCMP is expected to enhance CA across various dimensions like value creation and response rate (Linda & Thabrani, 2021). Li et al. (2006) examined several SCM practices, including SSP, CR, IS and postponement (POS). They found that such practices enhance OP_Fp and organizations’ competitiveness. CR involves initiatives and practices aimed at building lasting connections with customers, tracking, and addressing their enquiries and ensuring total satisfaction, thereby fostering long-term loyalty (Choon Tan et al., 2002; Claycomb et al., 1999) and enhancing the organization’s brand image (Chen & Popovich, 2003). IS is crucial for sustaining businesses and seamlessly integrating supply chains, as the extent and quality of this information directly impact an organization’s competitive position (Abdulameer & Yaacob, 2020; Dwivedi, 2020; Moberg et al., 2002). POS, a supply chain practice that delays specific actions until the final point, facilitates rapid, and flexible responses to demand variations while enabling cost-effective product customization, offering a CA (Budiman & Rau, 2021; Dong et al., 2023; Yang, 2014). Reducing cost and inventory holding, POS provides for product variety and enhances the overall OP (Prataviera et al., 2020).
Competitive Advantage
CA refers to the unique and valuable strengths, either inherent within an organization or developed over time, that set it apart from its competitors (Prahalad & Hamel, 1990). These specific strengths, which are either exclusive or complex for competitors to replicate (Afraz et al., 2021), outline the crucial elements that organizations influence directly in supply chain production, thereby providing opportunities for CA (Cahyono et al., 2023; Javid & Amini, 2023). Listed companies use benchmarking as a strategic approach to gain a CA (Gichinga & Mukulu, 2015). With increasing consumer demand for quicker access to goods and services, reducing delivery time has become a key CA (Sharabati, 2023). Achieving a CA in one or more business aspects has been shown to enhance the overall OP (Cahyono et al., 2023; Li et al., 2006; Linda & Thabrani, 2021; Singh et al., 2018).
Organizational Performance
OP refers to the measurable outcomes or achievements of a firm, assessed against its set objectives. It is evaluated using specific metrics such as sales, market share, market share growth rate, return on investment, profit, profit margin and the overall position of the firm (Budianto & Dewi, 2023; Hamann & Schiemann, 2021; O’Boyle & Hassan, 2013). Internal factors such as liquidity and leverage significantly impact OP (Purwanto & Purwanto, 2020). Le (2023) expanded the understanding of OP to include organizational effectiveness, while (Al-Madi, 2017) customer satisfaction, operational efficiency, and corporate social responsibility to enhance value and overall OP. Previous studies have confirmed that OP can be improved through CA (Cahyono et al., 2023; Economou & Chatzikonstantinou, 2009; Li et al., 2006; Singh et al., 2018).
SCM Agility
SCMA encompasses the ability to predict, detect and respond swiftly to situations and recognize and adapt quickly to market dynamics (Aslam et al., 2020; Braunscheidel & Suresh, 2018). Agile companies, by rapidly recognizing market changes and implementing synchronous responses, can gain significant first-mover, and other CA while incorporating agility into a supply chain significantly enhances OP (Abdallah et al., 2021; Braunscheidel & Suresh, 2018; Sturm et al., 2022). The components that enhance the agility within a supply chain include new technologies, speed, accountability, expertise, adaptable systems, and cost-effectiveness, while the SCM architecture determines the extent of an organization’s innovative capacity and OP (Baramichai et al., 2007; DeGroote & Marx, 2013; Hamann & Schiemann, 2021; Najar, 2022; Patel & Sambasivan, 2022; Shukor et al., 2021).
Research Methodology
The current study seeks to examine whether there are differences in SCMP, CA, SCMA, and OP between listed and unlisted pharmaceutical companies in India, as well as across various company categories, including large-cap, mid-cap, small-cap, and unlisted companies. The data were gathered using a structured questionnaire, developed through a comprehensive literature review and pilot-tested in Goa. Items for the constructs of SCMP, CA, and OP were adapted from Li et al. (2006), while SCMA items were designed based on the author’s understanding of the subject through the literature. The questionnaire consisted of 63 questions assessing the four constructs: SCMP, CA, OP, and SCMA. It was administered to 1,000 pharmaceutical companies using purposive sampling. The 1,000 pharmaceutical companies were chosen from listed and unlisted space ensuring contributions from small-cap, mid-cap, large-cap, and unlisted firms. Data collection resulted in 227 complete responses from supply chain professionals across various pharmaceutical companies, resulting in a response rate of 22.7%. The data were statistically analyzed using IBM SPSS 26 and Smart PLS 4. Various statistical tests were conducted to test for the reliability and validity of the instrument questionnaire. Under these measures, content validity, unidimensionality, multicollinearity (VIF), internal consistency, and discriminant validity were determined. Due to the skewness observed in the data set, statistical tests like the Mann–Whitney U test were used to evaluate differences between listed and unlisted companies based on the parameters selected. However, further evaluation was done using the Kruskal–Wallis test to assess differences between listed companies (large-cap, mid-cap, and small-cap) and unlisted companies. The study was based on the following framework for listed and unlisted companies.
The Indian pharmaceutical sector comprises both listed and unlisted companies, as well as companies of varying sizes based on market capitalization. While structural and operational differences exist between these groups, it remains unclear whether these differences significantly affect their SCMP, CA, OP, and SCMA. The following null hypotheses are proposed to assess whether these organizational differences result in statistically significant variations, ensuring an objective evaluation of their influence on supply chain effectiveness and performance outcomes.
H01: There is no significant difference in SCMP, SCMA, CA, and OP between listed and unlisted companies
H02: There is no significant difference in SCMP, SCMA, CA, and OP between small-cap, mid-cap, large-cap, and unlisted companies.
Data Analysis and Interpretation
Demographics
The study surveyed 227 pharmaceutical companies, both listed and unlisted. Of these, 135 companies (59.4%) were unlisted, while the remaining 92 listed companies were categorized as large-cap (12), mid-cap (16), and small-cap (64), according to BSE classification. The companies were further divided by focus areas: 136 (60%) specialized in formulations, 37 (16.3%) in active pharmaceutical ingredients (API), 19 (8.3%) in contract research and manufacturing services (CRAMS), and 35 (15.4%) in other pharmaceutical segments. The majority of the respondents are unlisted on Indian stock exchanges and are primarily involved in pharmaceutical formulations.
Measurement Model
To ascertain the validity of the questionnaire’s content, it was evaluated by a panel of four academic experts. Following their suggestions, minor adjustments were implemented, and a pilot survey was carried out with 10 respondents to validate the content. Unidimensionality was ensured through exploratory factor analysis, with a threshold of 0.5 for factor loadings, as recommended by Hair et al. (2017). The SCMP construct had 28 items over five dimensions. The items that failed to meet the threshold or had cross-loadings were deleted. The CA construct had 17 items spread across five dimensions, while both OP and SCMA had 7 and 11 items across two dimensions each. No items were deleted from the CA, OP, and SCMA constructs. The variance inflation factor (VIF) measure was used to identify collinearity issues (García et al., 2015). All the VIF values ranged from 0.1 to 5; hence, no collinearity issues existed. According to Cronbach (1951), reliability is achieved when all the alpha values are equal to or above 0.70. In this case, all the values were above 0.70, confirming an acceptable level of internal consistency. Fornell and Larcker (1981) proposed that the diagonal elements must exceed 0.5 to establish discriminant validity, reflecting each construct’s square root of the average variance extracted. Additionally, they emphasized that the highest loadings within each construct should be prioritized, further supporting the distinctiveness of each construct. The given data set satisfied both conditions, thus confirming discriminant validity. Covariance-based structural equation modeling (CB-SEM) exhibited the following values for the goodness of fit: chi-square value (342.22), p-value (.000), RMSEA (0.13), GFI (0.827), AGFI (0.743), SRMR (0.73), NFI (0.865), TLI (0.858), and CFI (0.88). Therefore, according to the framework proposed by Hair et al. (2014), the model displays a satisfactory level of goodness of fit.
Mann–Whitney U Test
Mann–Whitney U test was performed to analyze the differences between listed and unlisted companies holistically.
As evident from Table 1, the p values for all the subconstructs are greater than 0.05, indicating that no significant differences were observed between listed and unlisted companies across the constructs.
Table 1. Independent-samples Mann–Whitney U Test.
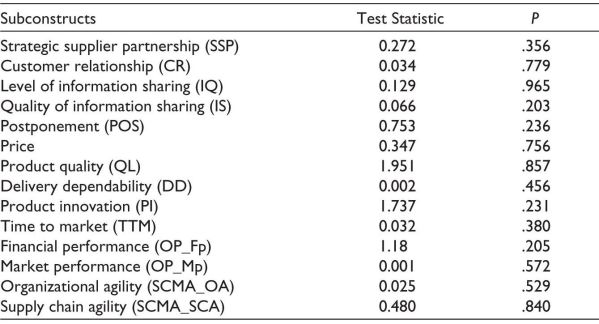
Source: Authors’ analysis using SPSS 26.
Structural Equation Modeling
SEM analysis compared SCMP OP, CA, and SCMA in listed and unlisted companies.
Figure 2 illustrates the SEM analysis diagram, showing the direct and indirect impact of SCMP, SCMA, and CA on OP in listed pharmaceutical companies. SCMP has a direct impact of 21.4% on OP, 39.1% on CA and 68.3% on SCMA. The impact of CA and SCMA on OP is 29.4% and 39.9%, respectively. Finally, SCMA has an impact of 53.1% on CA.
Figure 3 illustrates the SEM analysis diagram, showing the direct and indirect impact of SCMP, SCMA, and CA on OP in unlisted pharmaceutical companies. SCMP has a direct impact of 5.8% on OP, 25.3% on CA, and 67.7% on SCMA. The impact of CA and SCMA on OP is 48% and 34.8%, respectively. Finally, SCMA has an impact of 53.1% on CA.
Figure 2. SEM Analysis for Listed Companies.
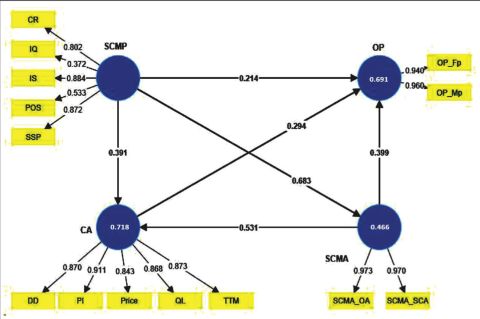
Source: Authors’ analysis using SmartPLS 4.
Figure 3. SEM Analysis for Unlisted Companies.
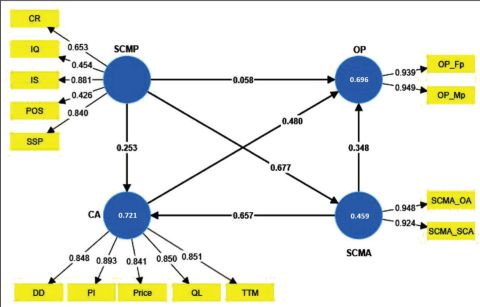
Source: Authors’ analysis using SmartPLS 4.
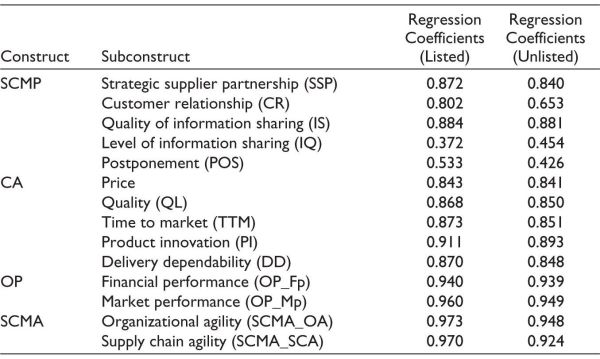
In Table 2, no significant difference was observed in the regression coefficients of SCMP, CA, OP, and SCMA between the listed and unlisted companies in the second-order SEM analysis.
Table 2. Regression Coefficients for Listed and Unlisted Companies Through SEM Analysis.
Source: Authors’ analysis from SEM analysis.
Kruskal–Wallis Test
The Kruskal–Wallis test was used to analyze the differences between large-cap, mid-cap, small-cap, and unlisted c ompanies.
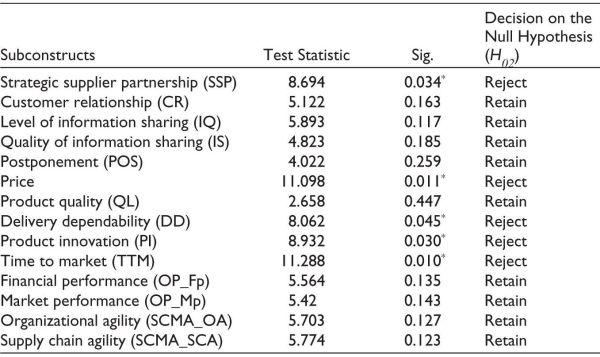
Table 3 indicates significant differences in SSP, Price, DD, PI, and TTM, as the p-value is less than .05 at a 95% confidence interval. To further explore these differences, pairwise comparisons were conducted.
Table 3. Independent-samples Kruskal–Wallis Test.
Source: Authors’ analysis using SPSS 26.
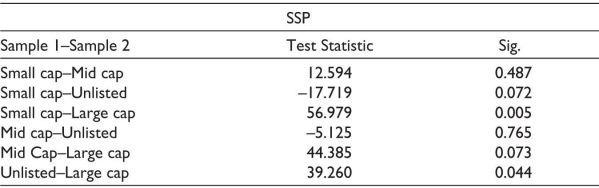
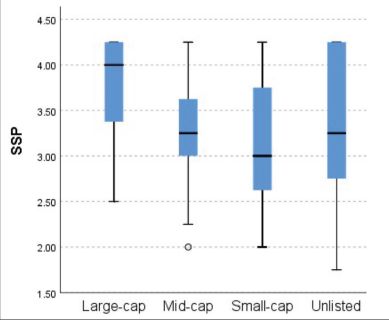
As seen in Table 4, large and small-cap companies exhibit significant differences in terms of SSP with test statistics (56.979) and p-value (.005). Large-cap and unlisted companies also exhibit differences in SSP with test statistics (39.260) and p-value (.044). The differences have been presented graphically below.
Table 4. Pairwise Comparison of Listing Status on SCMP.
Source: Authors’ analysis using SPSS 26.
Box plots indicate independent-samples Kruskal–Wallis test for various subconstructs.
As evident in Figure 4, SSP has the highest median in large-cap companies, followed by equal importance in mid-cap and unlisted, and finally, the small-cap companies.
Figure 4. Strategic Supplier Partnership.
.jpg/10_1177_25819542251325952-fig5(1)__370x320.jpg)
Source: Authors’ analysis using SPSS 26.
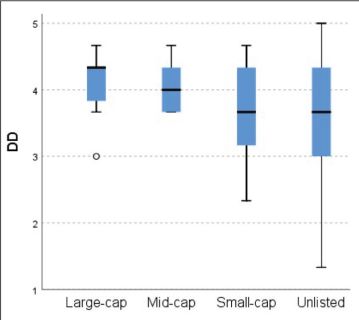
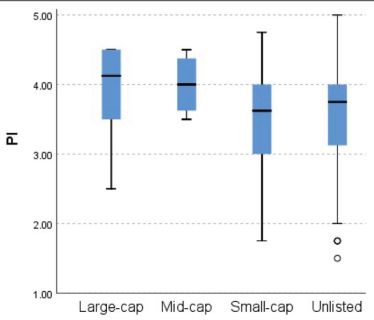
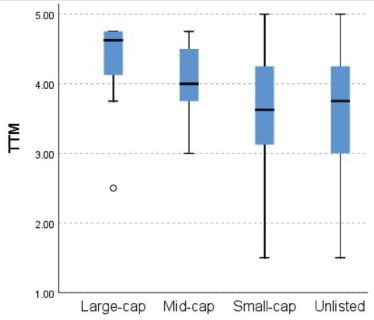
In Table 5, differences in price, DD, PI, and TTM as a measure of CA were observed in large-cap, small-cap, and unlisted companies, as the p-value is less than .05. As evident in Figure 5, price variations are least in large-cap, followed by mid-cap and small-cap. Unlisted companies are seen to have the highest variations in their prices. The median price for mid-cap, small-cap, and unlisted companies is equal. In Figure 6, large-cap and mid-cap companies have the highest DD, while small-cap and unlisted companies have the same median in DD with higher variations in the unlisted companies. As seen in Figure 7, large-cap companies, followed by mid-cap companies, are the pioneers of PI, followed by unlisted and small-cap companies, which display wide and similar levels of variation. In Figure 8, large-cap followed by mid-cap companies are the fastest in TTM, while the unlisted and small-cap companies exhibit similar medians and variations throughout the journey from pharmaceutical product development to commercialization.
Table 5. Pairwise Comparison of Listing Status on Competitive Advantage.
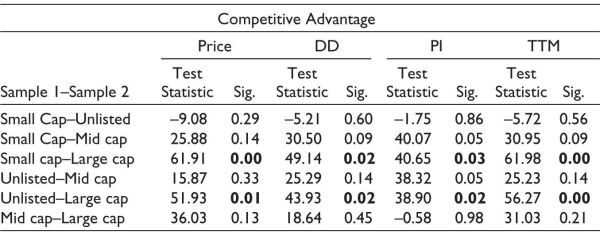
Source: Authors’ analysis as per the above box plots.
Figure 5. Price.
Source: Authors’ analysis using SPSS 26.
Figure 6. Delivery Dependability.
Source: Authors’ analysis using SPSS 26.
Figure 7. Product Innovation.
Source: Authors’ analysis using SPSS 26.
Figure 8. Time to Market.
Source: Authors’ analysis using SPSS 26.
Results and Discussion
The study aimed to identify any notable differences in SCMP, SCMA, OP, and CA between listed and unlisted Indian pharmaceutical companies and to explain the reasons for these differences. Initially, the Mann–Whitney U test revealed no significant differences between listed and unlisted companies in SCMP, SCMA, CA, and OP. Consequently, further analysis was conducted by categorizing the listed companies into large-cap, mid-cap, and small-cap companies according to the BSE market capitalization and using the Kruskal–Wallis test.
Upon performing the Mann–Whitney U test, the p-value for all the subconstructs was more significant than .05. At the same time, no significant difference was observed among the regression coefficients between the listed and unlisted companies in the second-order SEM analysis. Therefore, H01 was found to be significant and, thus, accepted. Therefore, we conclude that no significant difference exists between listed and unlisted companies in SCMP, SCMA, CA, and OP when the two groups were compared holistically.
The data were further analyzed by grouping it into large-cap, mid-cap, small-cap and unlisted companies for analysis through the Kruskal–Wallis test. On performing the Kruskal–Wallis test, the p values for SSP (.034), price (.011), DD (.045), PI (.030) and TTM (.010) were found to be less than .05 at a 95% confidence interval indicating significant differences between large-cap, small-cap, and unlisted companies. H02 is not significant and, thus, not supported. Significant differences exist between SSP, price, DD, PI, and TTM among large-cap, small-cap, and unlisted companies.
In SCMP, differences exist in SSP among large-cap, small-cap, and unlisted companies. Large-cap and unlisted companies have higher SSP levels followed by mid-cap and small-cap companies. Unlisted companies, followed by small- and mid-cap, exhibit the highest variation, with large-cap having the lowest variations in SSP.
For CA, price, DD, PI, and TTM differences exist among large-cap, small-cap, and unlisted pharmaceutical companies. The box plot shows that large-cap companies have the highest median prices, while mid-cap, small-cap, and unlisted companies have similar median prices. Unlisted companies exhibit greater price variability, while large-cap companies have a similar price range. Large-cap companies display the highest median DD value, followed by mid-caps, while small-cap and unlisted companies display similar levels of DD. Unlisted companies are ranked highest, while all the other categories show moderate variability in DD. All the companies display similar levels of PI, with the large-cap having the highest PI and the small cap the lowest. The highest variations in PI are seen in small-cap and unlisted companies. Large-caps lead the race in TTM followed by the mid-caps, unlisted and small-cap companies. The highest variation is seen in small-cap and unlisted companies.
Conclusion and Managerial Implications
The study finds that (a) there are no significant differences in SCMP, SCMA, CA, and OP between listed and unlisted Indian pharmaceutical companies when examined comprehensively. The results of the Mann–Whitney U test and second-order SEM analysis corroborate this, with p values and regression coefficients showing no substantial variation between the two groups. Both listed and unlisted companies exhibit uniformity in these areas. (b) Notable differences were identified in SCMP and CA across large-cap, small-cap, and unlisted pharmaceutical companies. Large-cap companies are ranked highest in SSP, price, DD, PI, and TTM, followed by mid-cap, unlisted, and small-cap companies. While unlisted and small-cap companies exhibited the greatest variability in these metrics, large-cap companies showed greater stability, with mid-cap companies falling between large-cap and unlisted firms.
The findings of this study provide key managerial insights for pharmaceutical companies. Notably, large-cap companies capitalize on economies of scale to optimize pricing, foster product innovation, and ensure timely delivery, thus securing a competitive edge. Smaller companies, on the other hand, may need to concentrate on forming strategic partnerships and strengthening their supply chain capabilities to compete with the performance of larger firms.
For mid-cap and small-cap companies, investing in research and development (R&D) and adopting advanced supply chain technologies can improve product offerings and boost operational efficiency. Additionally, it was observed that the implementation of DD and PI strategies is crucial for achieving CA. Managers should focus on refining SCMP, pricing strategies, and innovation efforts to improve OP.
The limitations of this study include its cross-sectional design, which captures data at a single point in time, thus limiting the ability to track trends or changes over time. Additionally, integrating qualitative methods, such as case studies or interviews, could provide a deeper understanding of the contextual factors influencing these variables. Future research could further explore the impact of emerging technologies, regulatory changes, and market disruptions on the pharmaceutical sector’s supply chain and competitive strategies.
Declaration of Conflicting Interests
The authors declared no potential conflicts of interest with respect to the research, authorship and/or publication of this article.
Funding
The authors received no financial support for the research, authorship and/or publication of this article.
ORCID iDs
Anand Sharma https://orcid.org/0009-0004-3099-1711
Pooja Arora https://orcid.org/0000-0003-3108-799X
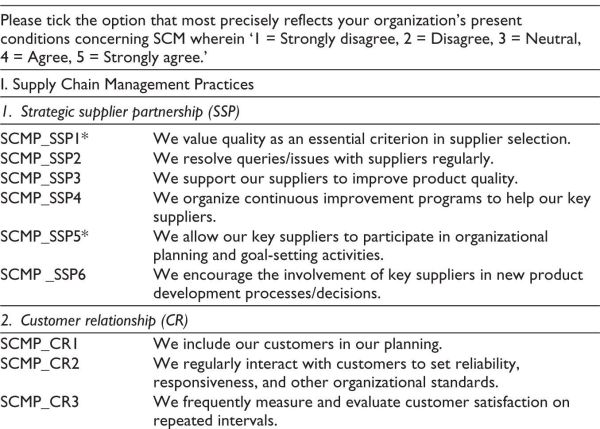
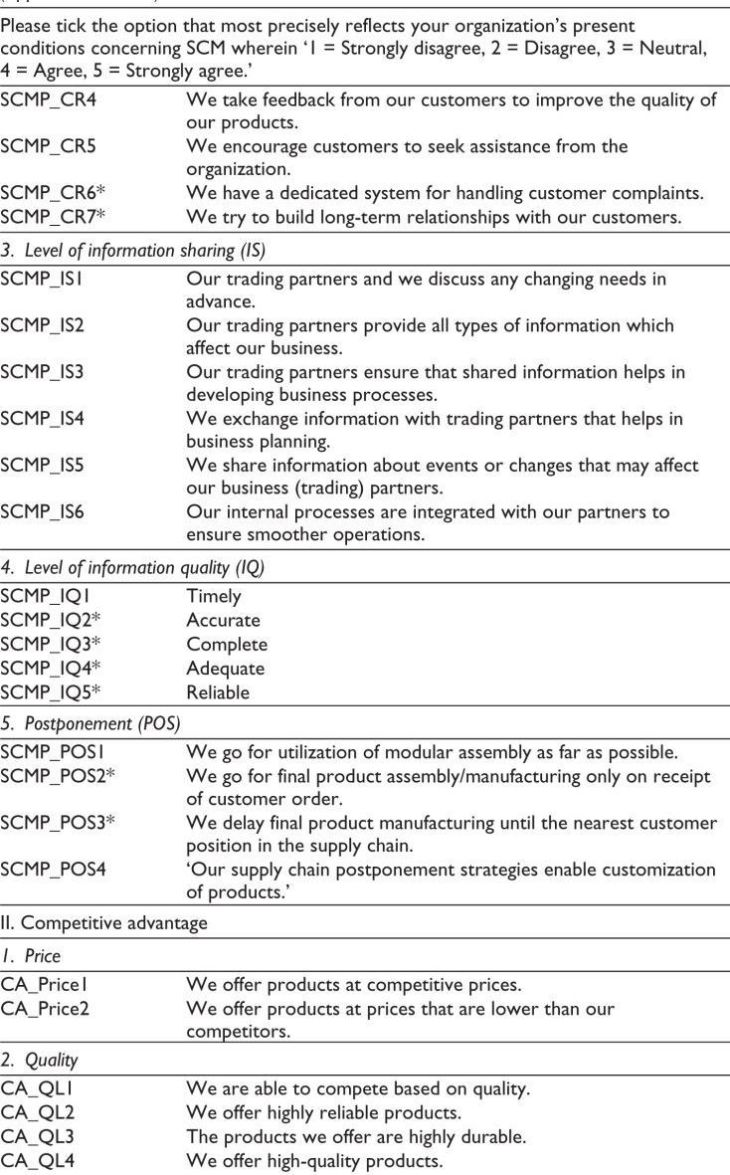
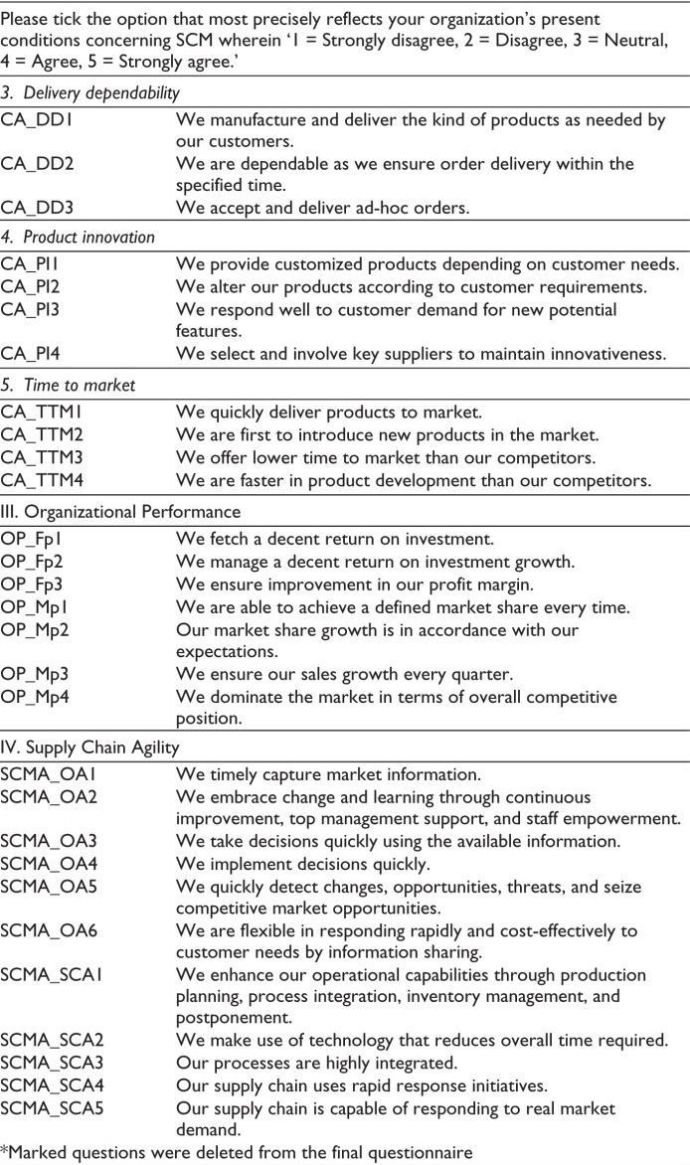
Appendix
A. Questionnaire instrument for SCMP, SCMA, CA, and OP
Al-Homaidi, A. E., Mohammed Al-Matari, E., Tabash, I. M., Khaled, S. D. A., & Senan, A. M. N. (2021). The influence of corporate governance characteristics on profitability of Indian firms: An empirical investigation of firms listed on Bombay Stock Exchange. Investment Management and Financial Innovations, 18(1), 114–125. https://doi.org/10.21511/imfi.18(1).2021.10
Abdallah, A. B., Alfar, N. A., & Alhyari, S. (2021). The effect of supply chain quality management on supply chain performance: The indirect roles of supply chain agility and innovation. International Journal of Physical Distribution & Logistics Management, 51(7), 785–812.
Abdulameer, S. S., & Yaacob, N. A. (2020). The moderating role of information sharing on the relationship between lean supply chain and supply chain performance: A conceptual framework. International Journal of Supply Chain Management, 9(1), 9.
Afraz, M. F., Bhatti, S. H., Ferraris, A., & Couturier, J. (2021). The impact of supply chain innovation on competitive advantage in the construction industry: Evidence from a moderated multi-mediation model. Technological Forecasting and Social Change, 162, 120370.
Al-Madi, D. F. (2017). The impact of supply chain management practices on supply chain performance in the Jordanian industrial sector. European Journal of Business and Management, 16, 150–165.
Aslam, H., Khan, A. Q., Rashid, K., & Rehman, S. (2020). Achieving supply chain resilience: The role of supply chain ambidexterity and supply chain agility. Journal of Manufacturing Technology Management, 31(6), 1185–1204. https://doi.org/10.1108/JMTM-07-2019-0263
Baramichai, M., Zimmers Jr, E. W., & Marangos, C. A. (2007). Agile supply chain transformation matrix: An integrated tool for creating an agile enterprise. Supply Chain Management: An International Journal, 12(5), 334–348.
Braunscheidel, M. J., & Suresh, N. C. (2018). Cultivating supply chain agility: Managerial actions derived from established antecedents. In Y. Khojasteh (Ed.), Supply chain risk management (pp. 289–309). Springer Singapore. https://doi.org/10.1007/978-981-10-4106-8_17
Budianto, E. W. H., & Dewi, N. D. T. (2023). Net profit margin (NPM) ratio in Islamic and conventional banking: Mapping research topics using VOSviewer bibliometric study and library research. https://www.academia.edu/download/108427945/NPM_Inggris.pdf
Budiman, S. D., & Rau, H. (2021). A stochastic model for developing speculation-postponement strategies and modularization concepts in the global supply chain with demand uncertainty. Computers & Industrial Engineering, 158, 107392.
Cahyono, Y., Purwoko, D., Koho, I., Setiani, A., Supendi, S., Setyoko, P., Sosiady, M., & Wijoyo, H. (2023). The role of supply chain management practices on competitive advantage and performance of halal agroindustry SMEs. Uncertain Supply Chain Management, 11(1), 153–160.
Chen, I. J., & Popovich, K. (2003). Understanding customer relationship management (CRM): People, process and technology. Business Process Management Journal, 9(5), 672–688.
Choon Tan, K., Lyman, S. B., & Wisner, J. D. (2002). Supply chain management: A strategic perspective. International Journal of Operations & Production Management, 22(6), 614–631.
Claycomb, C., Dröge, C., & Germain, R. (1999). The effect of just-in-time with customers on organizational design and performance. The International Journal of Logistics Management, 10(1), 37–58.
Cronbach, L. J. (1951). Coefficient alpha and the internal structure of tests. Psychometrika, 16(3), 297–334.
DeGroote, S. E., & Marx, T. G. (2013). The impact of IT on supply chain agility and firm performance: An empirical investigation. International Journal of Information Management, 33(6), 909–916.
Dong, L., Xiao, G., & Yang, N. (2023). Supply diversification under random yield: The impact of price postponement. Production and Operations Management, 32(4), 1112–1132. https://doi.org/10.1111/poms.13915
Dwivedi, R. (2020). Business excellence: Exploring key performance indicators and suitable business model. Parikalpana KIIT Journal of Management, 16, 108. https://doi.org/10.23862/kiit-parikalpana/2020/v16/i1-2/204560
Economou, V. P., & Chatzikonstantinou, P. G. (2009). Gaining company’s sustained competitive advantage, is really a necessary precondition for improved organizational performance? The case of TQM. https://www.um.edu.mt/library/oar/handle/1234 56789/32155
Faggioni, F., Rossi, M. V., & Sestino, A. (2023). Supply chain resilience in the pharmaceutical industry: A qualitative analysis from scholarly and managerial perspectives. International Journal of Business and Management, 18(1), 129.
Fornell, C., & Larcker, D. F. (1981). Structural equation models with unobservable variables and measurement error: Algebra and statistics. Sage Publications.
García, C. B., García, J., López Martín, M. M., & Salmerón, R. (2015). Collinearity: Revisiting the variance inflation factor in ridge regression. Journal of Applied Statistics, 42(3), 648–661. https://doi.org/10.1080/02664763.2014.980789
Gichinga, L. W., & Mukulu, E. (2015). The use of benchmarking practices in achieving competitive advantage in Kenyan universities. http://www.ijmrbs.com/ijmrbsadmin/upload/IJMRBS_55264fd8d1ade.pdf
Gupta, N., Mittal, S., Agarwal, T., Bakhshi, P., & Sahoo, M. (2022). Ownership concentration and bank performance: Evidence from India. Cogent Economics & Finance, 10(1), 2114177. https://doi.org/10.1080/23322039.2022.2114177
Hair, J., Hollingsworth, C. L., Randolph, A. B., & Chong, A. Y. L. (2017). An updated and expanded assessment of PLS-SEM in information systems research. Industrial Management & Data Systems, 117(3), 442–458.
Hair, J. F., Gabriel, M., & Patel, V. (2014). AMOS covariance-based structural equation modeling (CB-SEM): Guidelines on its application as a marketing research tool. Brazilian Journal of Marketing, 13(2). https://papers.ssrn.com/Sol3/Papers.Cfm? Abstract_Id=2676480
Hamann, P. M., & Schiemann, F. (2021). Organizational performance as a set of four dimensions: An empirical analysis. Journal of Business Research, 127, 45–65.
Hess, D. (2019). The transparency trap: Non-financial disclosure and the responsibility of business to respect human rights. American Business Law Journal, 56(1), 5–53. https://doi.org/10.1111/ablj.12134
Javid, J. N., & Amini, M. (2023). Evaluating the effect of supply chain management practice on implementation of halal agroindustry and competitive advantage for small and medium enterprises. International Journal of Computer Science and Information Technology, 15(2023), 8997–9008.
Kumar, S., Teichman, S., & Timpernagel, T. (2012). A green supply chain is a requirement for profitability. International Journal of Production Research, 50(5), 1278–1296. https://doi.org/10.1080/00207543.2011.571924
Kuvshinov, D., & Zimmermann, K. (2022). The big bang: Stock market capitalization in the long run. Journal of Financial Economics, 145(2, Part B), 527–552. https://doi.org/10.1016/j.jfineco.2021.09.008
Le, T. T. (2023). Corporate social responsibility and SMEs’ performance: Mediating role of corporate image, corporate reputation and customer loyalty. International Journal of Emerging Markets, 18(10), 4565–4590.
Li, S., Ragu-Nathan, B., Ragu-Nathan, T. S., & Rao, S. S. (2006). The impact of supply chain management practices on competitive advantage and organizational performance. Omega, 34(2), 107–124.
Linda, M. R., & Thabrani, G. (2021). Supply chain management practices on competitive advantage with supply chain performance as moderating variable. Seventh Padang International Conference on Economics Education, Economics, Business and Management, Accounting and Entrepreneurship (PICEEBA 2021), 469–480. https://www.atlantis-press.com/proceedings/piceeba-21/125964005
Moberg, C. R., Cutler, B. D., Gross, A., & Speh, T. W. (2002). Identifying antecedents of information exchange within supply chains. International Journal of Physical Distribution & Logistics Management, 32(9), 755–770.
Moosivand, A., Ghatari, A. R., & Rasekh, H. R. (2019). Supply chain challenges in pharmaceutical manufacturing companies: Using qualitative system dynamics methodology. Iranian Journal of Pharmaceutical Research, 18(2), 1103.
Najar, T. (2022). Lean-Agile supply chain innovation performance; the mediating role of dynamic capability, innovation capacity, and relational embeddednes. Supply Chain Forum, 23(3), 285–306. https://doi.org/10.1080/16258312.2022.2031276
O’Boyle, I., & Hassan, D. (2013). Organizational performance management: Examining the practical utility of the performance prism. Organization Development Journal, 31(3), 51.
Patel, B. S., & Sambasivan, M. (2022). A systematic review of the literature on supply chain agility. Management Research Review, 45(2), 236–260.
Pattanshetty, S., Bhatt, K., Inamdar, A., Dsouza, V., Chattu, V. K., & Brand, H. (2023). Health diplomacy as a tool to build resilient health systems in conflict settings—A case of Sudan. Sustainability, 15(18), 13625.
Prahalad, C. K., & Hamel, G. (1990). The core competence. Harvard Business Review. https://api.taylorfrancis.com/content/chapters/edit/download?identifierName=doi&identifierValue=10.4324/9780080517889-chapter1&type=chapterpdf
Prataviera, L. B., Perotti, S., Melacini, M., & Moretti, E. (2020). Postponement strategies for global downstream supply chains: A conceptual framework. Journal of Business Logistics, 41(2), 94–110. https://doi.org/10.1111/jbl.12250
Purwanto, E., & Purwanto, A. D. B. (2020). An investigative study on sustainable competitive advantage of manufacture companies in Indonesia. Business: Theory and Practice, 21(2), 633–642. https://doi.org/10.3846/btp.2020.12256
Raju, R. (2024). Stock returns in India. Available at SSRN 4969249. https://papers.ssrn.com/sol3/papers.cfm?abstract_id=4969249
Sharabati, A. A. A. (2023). Lean operations and competitive advantage in the pharmaceutical industry. International Journal of Services and Operations Management, 44(3), 293. https://doi.org/10.1504/IJSOM.2023.129463
Shukor, A. A. A., Newaz, Md. S., Rahman, M. K., & Taha, A. Z. (2021). Supply chain integration and its impact on supply chain agility and organizational flexibility in manufacturing firms. International Journal of Emerging Markets, 16(8), 1721–1744. https://doi.org/10.1108/IJOEM-04-2020-0418
Singh, R., Sandhu, H. S., Metri, B. A., & Kaur, R. (2018). Supply chain management practices, competitive advantage and organizational performance: A confirmatory factor model. In Global Business Expansion: Concepts, Methodologies, Tools, and Applications (pp. 871–897). IGI Global. https://doi.org/10.4018/978-1-5225-5481-3.ch039
Sturm, S., Hohenstein, N.-O., Birkel, H., Kaiser, G., & Hartmann, E. (2022). Empirical research on the relationships between demand- and supply-side risk management practices and their impact on business performance. Supply Chain Management, 27(6), 742–761.
Wisner, J. D., Tan, K.-C., & Leong, K. (2021). Principles of supply chain management: A balanced approach. South-Western, Cengage Learning. http://dspace.vnbrims.org:13000/jspui/bitstream/123456789/4491/1/Supply%20Chain%20Management.pdf
Yang, J. (2014). Supply chain agility: Securing performance for Chinese manufacturers. International Journal of Production Economics, 150, 104–113. https://doi.org/10. 1016/j.ijpe.2013.12.01
